Break-Even Analysis Tool: Formula and Calculation
Introduction to Breakeven Analysis Tool
Every business faces a critical question: “When will I start making a profit?” The break-even analysis tool provides that answer with mathematical precision. This financial compass reveals the exact sales volume needed to cover all costs—helping startups validate business models, established companies price new products, and investors assess venture viability. Unlike complex financial statements, break-even analysis distills profitability into a single actionable number. Whether you’re launching a bakery or manufacturing medical materials, mastering this tool transforms guesswork into strategic decision-making. In this guide, you’ll learn the simple formula behind this powerful metric, explore real-world applications, and gain access to our interactive calculator for instant insights.
Mastering Break-Even Analysis: Your Blueprint for Profitability
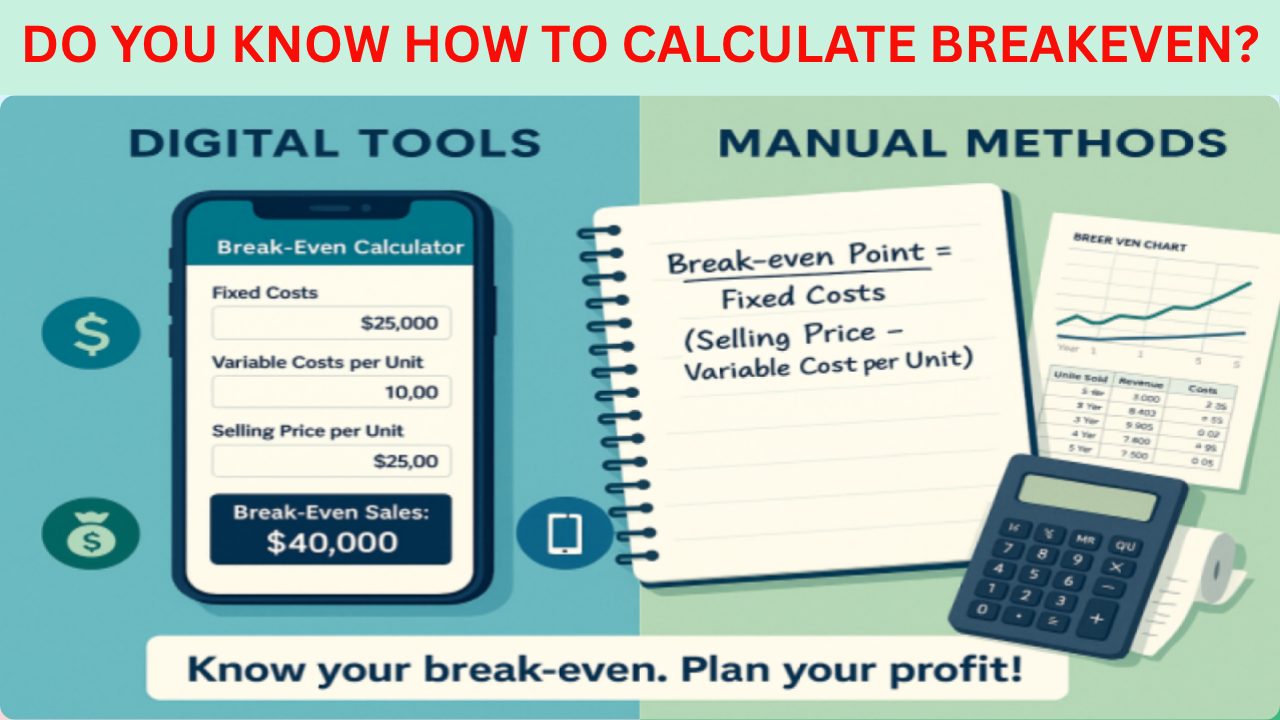
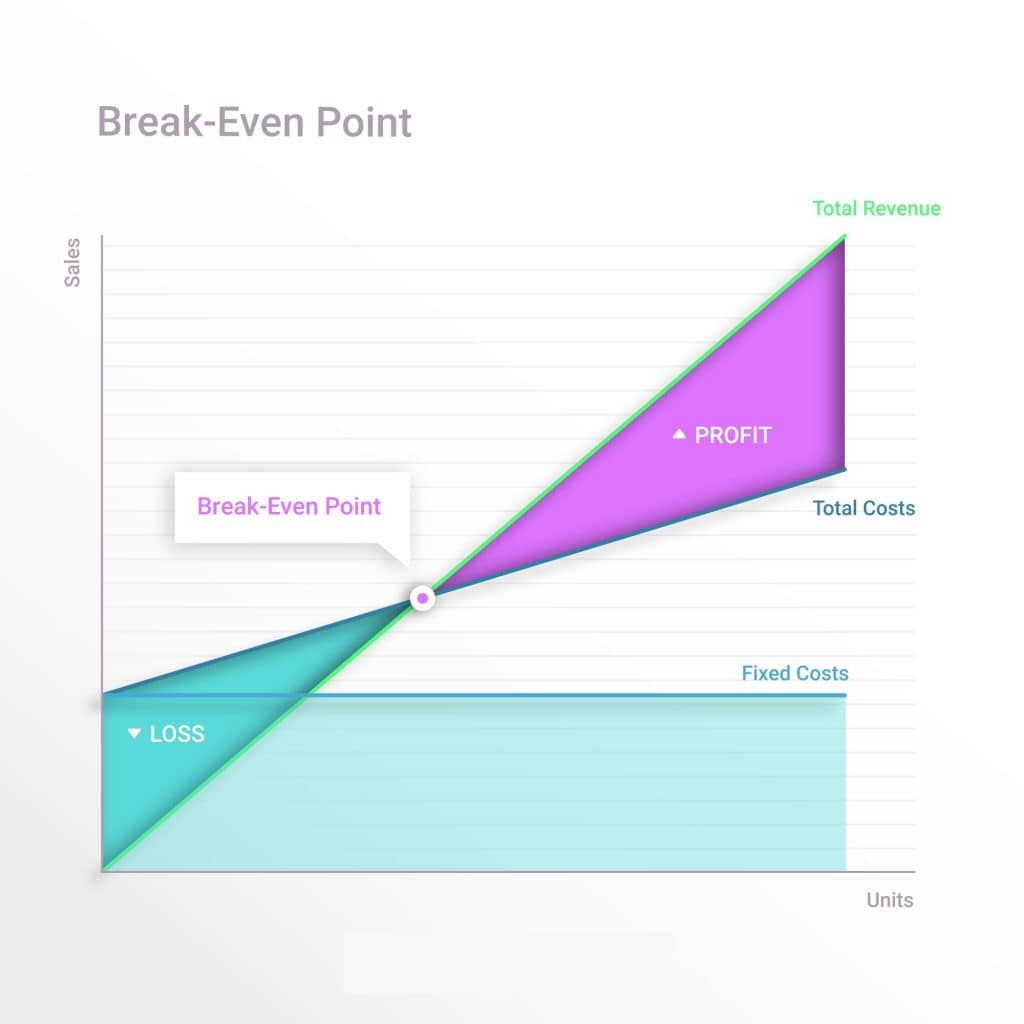
Break-even analysis calculates the point where total revenue equals total costs—no profit, no loss. This threshold determines your business’s financial viability and influences pricing, budgeting, and growth strategies. The core formula is deceptively simple:
Break-Even Point (Units) = Fixed Costs ÷ (Selling Price per Unit – Variable Cost per Unit)
Where:
- Fixed Costs: Expenses unchanged by sales volume (rent, salaries, insurance)
- Variable Costs: Expenses scaling with production (materials, shipping, commissions)
- Selling Price: Revenue generated per unit sold
For example: Fixed Costs = $10,000 | Variable Cost/Unit = $5 | Selling Price/Unit = $25
Break-Even Units = 10,000 ÷ (25 – 5) = 500 units
Break-Even Sales Revenue = 500 units × $25 = $12,500
How Break-Even Analysis tool Fuels Business Planning
Break-even analysis isn’t just math it’s a strategic engine. Use it to:
- Validate Business Models: Prove viability before seeking funding.
- Optimize Pricing: Test how price changes impact profitability thresholds.
- Control Costs: Identify which fixed/variable costs most affect your break-even point.
- Set Sales Targets: Create data-driven goals for teams.
- Evaluate Scenarios: Model “what-ifs” like rent increases or bulk discounts.
For example construction startups often find initial pricing unsustainable due to high fixed costs and low sales. To adapt, they may shift from owning expensive machinery to leasing or outsourcing, reducing fixed costs, lowering break-even points, and enabling more flexible pricing.
The Limitations on Breakeven analysis tool You Can’t Ignore
While indispensable, break-even analysis has blind spots:
- Assumes Linear Relationships: Real-world variable costs rarely stay perfectly proportional (e.g., bulk discounts).
- Ignores Market Dynamics: Doesn’t account for competitors undercutting your prices.
- Single-Product Focus: Struggles with complex businesses selling multiple products at different margins.
- Static Snapshot: Market shifts like inflation or demand changes aren’t reflected.
Mitigate these by:
- Recalculating quarterly
- Adding buffers (e.g., +15% to fixed costs)
- Using it alongside cash flow projections
Real-Life Break-Even Calculation Tool: Coffee Shop Case Study
Imagine “BrewRight Café” launching with:
- Fixed Costs: $8,000/month (rent, staff, utilities)
- Variable Costs: $2.50/cup (coffee beans, cup, sleeve)
- Selling Price: $5.50/cup
Break-Even Units = $8,000 ÷ ($5.50 – $2.50) = 2,667 cups/month
Break-Even Revenue = 2,667 × $5.50 = $14,668.50
Interpretation: BrewRight needs to sell ~89 cups daily to break even. If their location averages 75 daily sales, they might:
- Raise prices to $6.00 (new break-even: 2,286 cups)
- Reduce fixed costs by $1,000 (new break-even: 2,333 cups)
- Negotiate variable costs down to $2.25 (new break-even: 2,462 cups)
Interactive Break-Even Analysis tool Calculator
Plug in your numbers below to instantly calculate your break-even point:
Break-Even Analysis Tool
Calculate when your business becomes profitable with this interactive financial tool
Financial Parameters
Costs that change with production volume (materials, labor, etc.)
Constant monthly expenses (rent, salaries, insurance, etc.)
Selling price for each unit of your product/service
Break-Even Point (Units)
Units needed to cover all costs
Break-Even Point (USD)
Revenue needed to cover all costs
Monthly Financial Analysis
Enter projected units sold for each month to analyze profitability
| Month | Units Sold | Fixed Cost (USD) | Variable Cost (USD) | Total Cost (USD) | Revenue (USD) | Profit (USD) |
|---|
Business Insight: The break-even point is where revenue equals total costs. Above this point, your business becomes profitable. Use this analysis to set realistic monthly sales targets and monitor your financial health. Adjust the units sold for each month to see how it affects your profitability.
How to Use This Breakeven Analysis Tool:
- Enter monthly/annual Fixed Costs (e.g., rent, salaries)
- Input Variable Costs per Unit (e.g., materials, labor per item)
- Specify Selling Price per Unit
- Click “Calculate” to see your break-even point
Check Run multiple scenarios—e.g., “What if I reduce fixed costs by 10%?” or “How does a 5% price increase affect my threshold?”
Conclusion on Breakeven Analysis Tool
Break-even analysis is the foundational checkpoint between operating at a loss and generating profit. By combining the formula with our interactive calculator, you can transform abstract costs into concrete sales targets. Remember: This tool is your starting line—not the finish. Pair it with cash flow forecasting and sensitivity analysis for robust financial planning.